
Making Neighborhoods
Making Neighborhoods follows neighborhood change across New York City and the surrounding region by putting people at the center of the analysis.ROLE: cartographer/UX DESIGNer/RESEARCHER
FORMAT: INTERACTIVE WEB-BASED MAP & DATA VISUALIZATION DASHBOARD
INTRO
CHPC’s Making Neighborhoods initiative (2014-2018) explored neighborhood change across New York City and the New York metropolitan region by putting people at the center of its analysis.
All New Yorkers can recognize changes to their neighborhood and their city. Old neighbors move away; new people arrive; unfamiliar languages are suddenly heard on the streets; subway stops are more crowded with new faces; favorite shops are replaced by new ones, which quickly become part of the landscape. Some communities experience change through absence and loss, others through gains and discovery.
Why Making Neighborhoods?
New Yorkers recognize these changes without the benefit of demographic studies. They know that their neighborhoods aren’t defined by maps of community districts or legislative lines. It is the people living in a neighborhood who shape its identity—they make the neighborhood.
And yet policymakers entirely depend on artificial government-drawn boundaries when trying to understand the issues of our population and our neighborhoods. Data about the population will be broken down by community district or by sub-borough area, for example, which can obscure wider trends that cross those boundaries.
A clearer understanding of New York City’s changing population, residential patterns, and how they shape our neighborhoods, is critical in order to spot trends, identify pressing issues, allocate scarce resources, and intercede to address emerging problems.
In 2015, CHPC released the first Making Neighborhoods report and interactive map studying demographic change in New York City in the decade spanning 2000 to 2010.
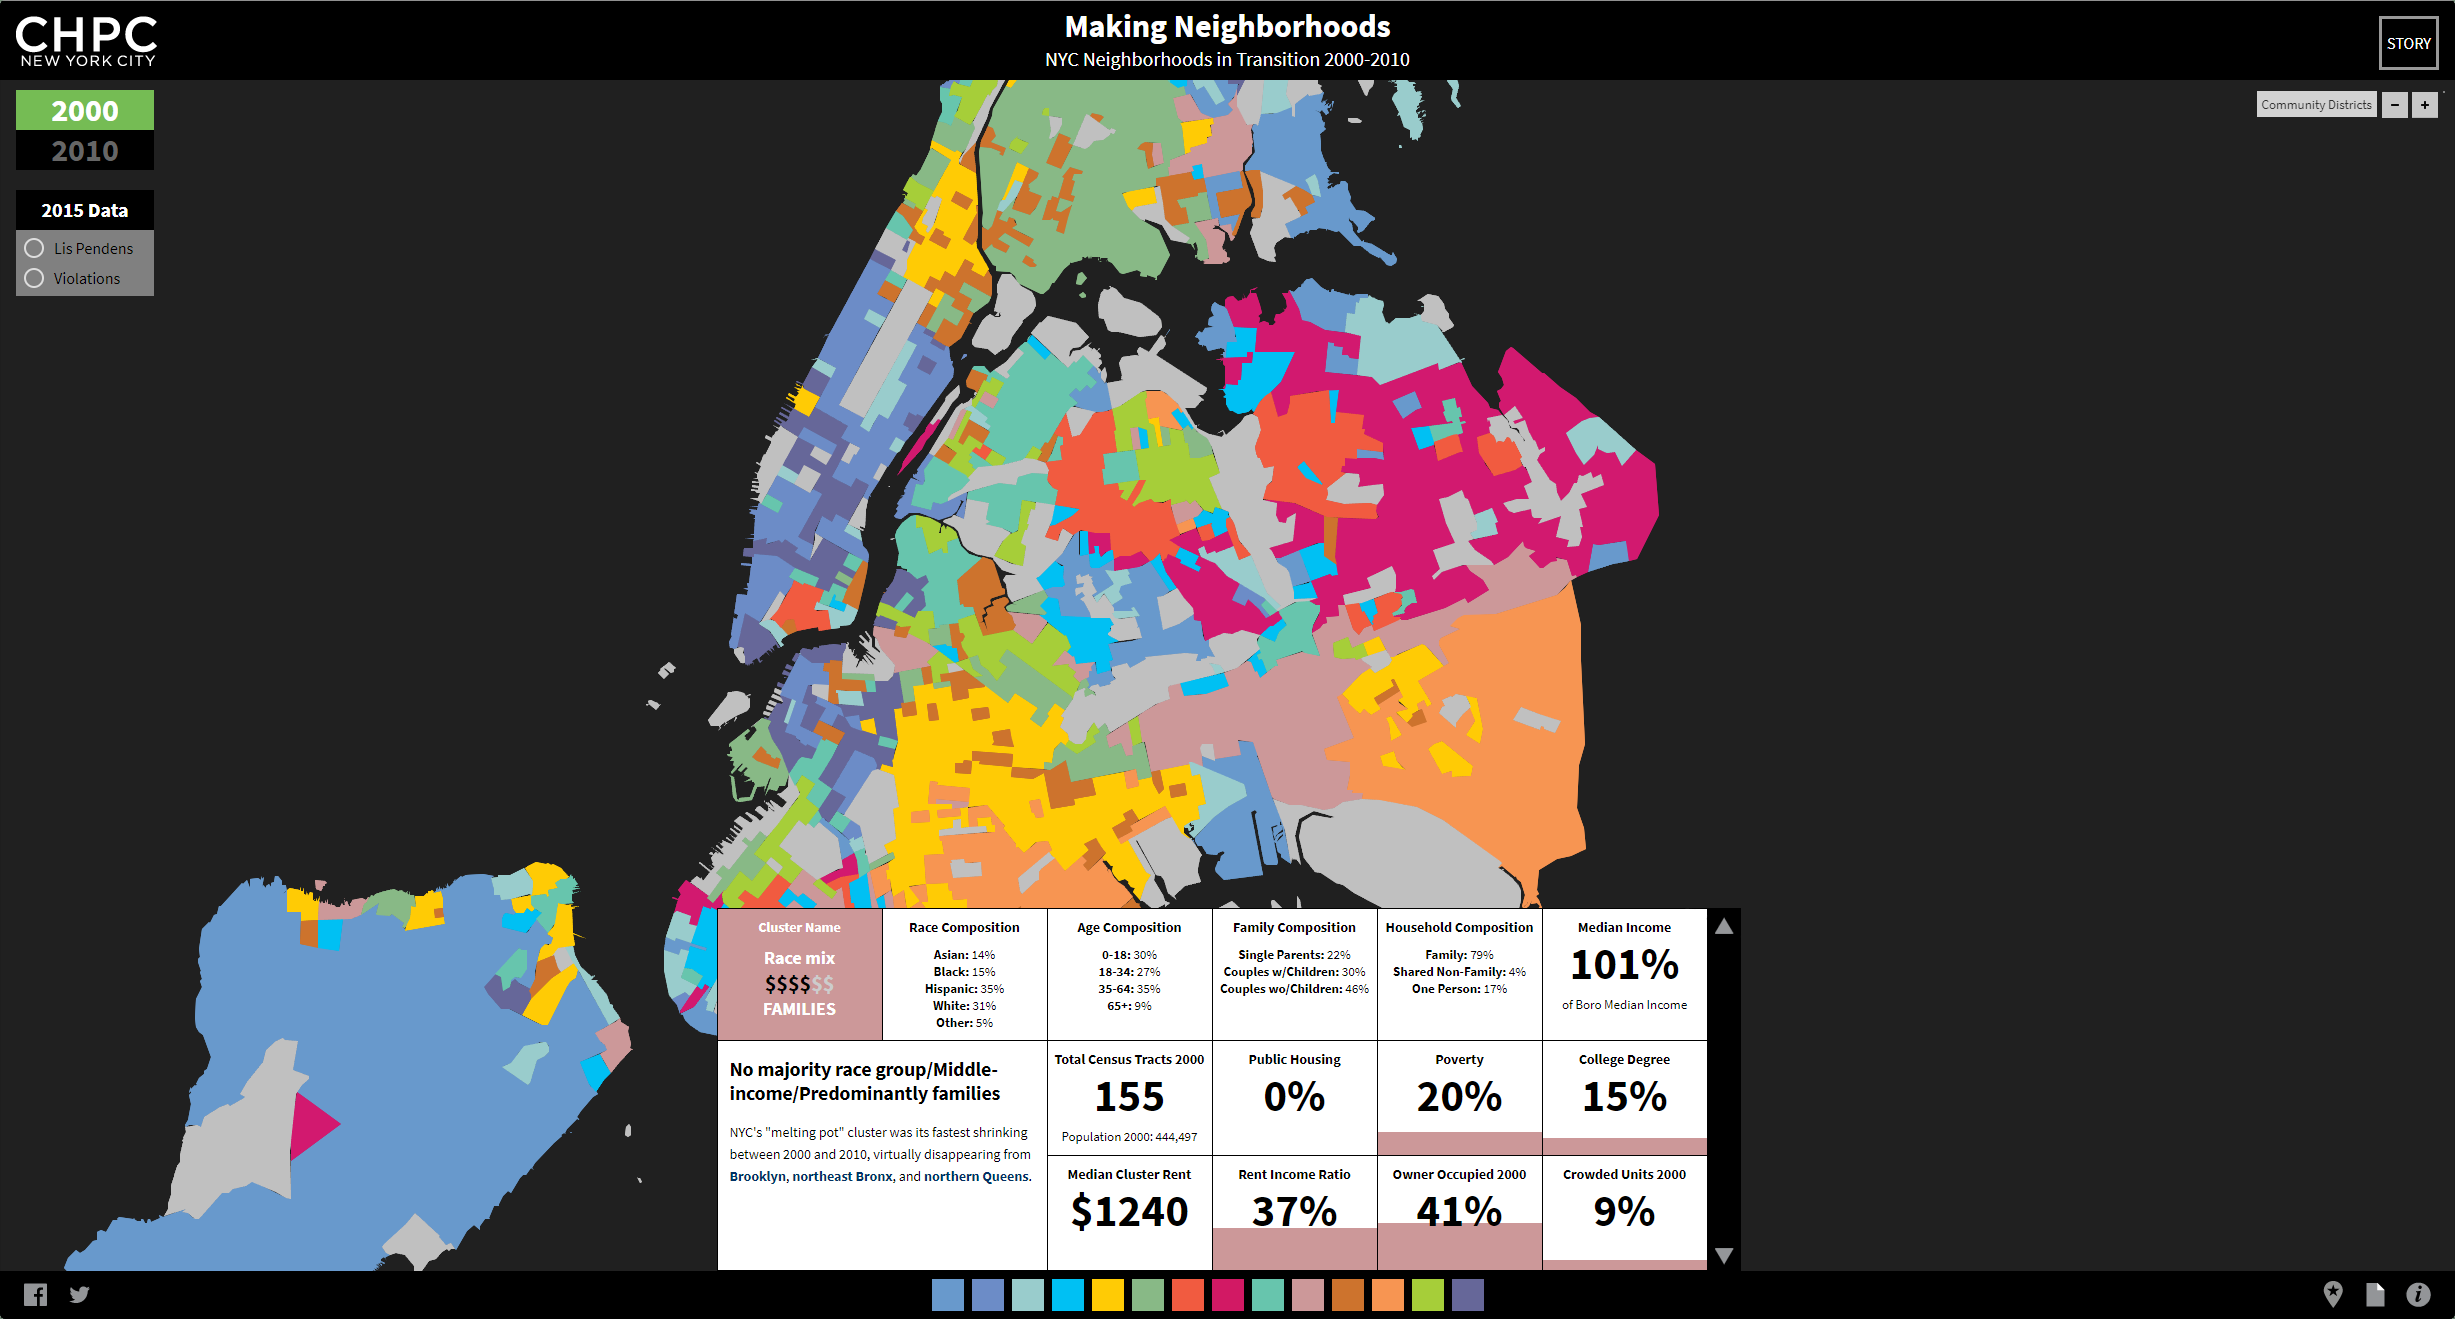
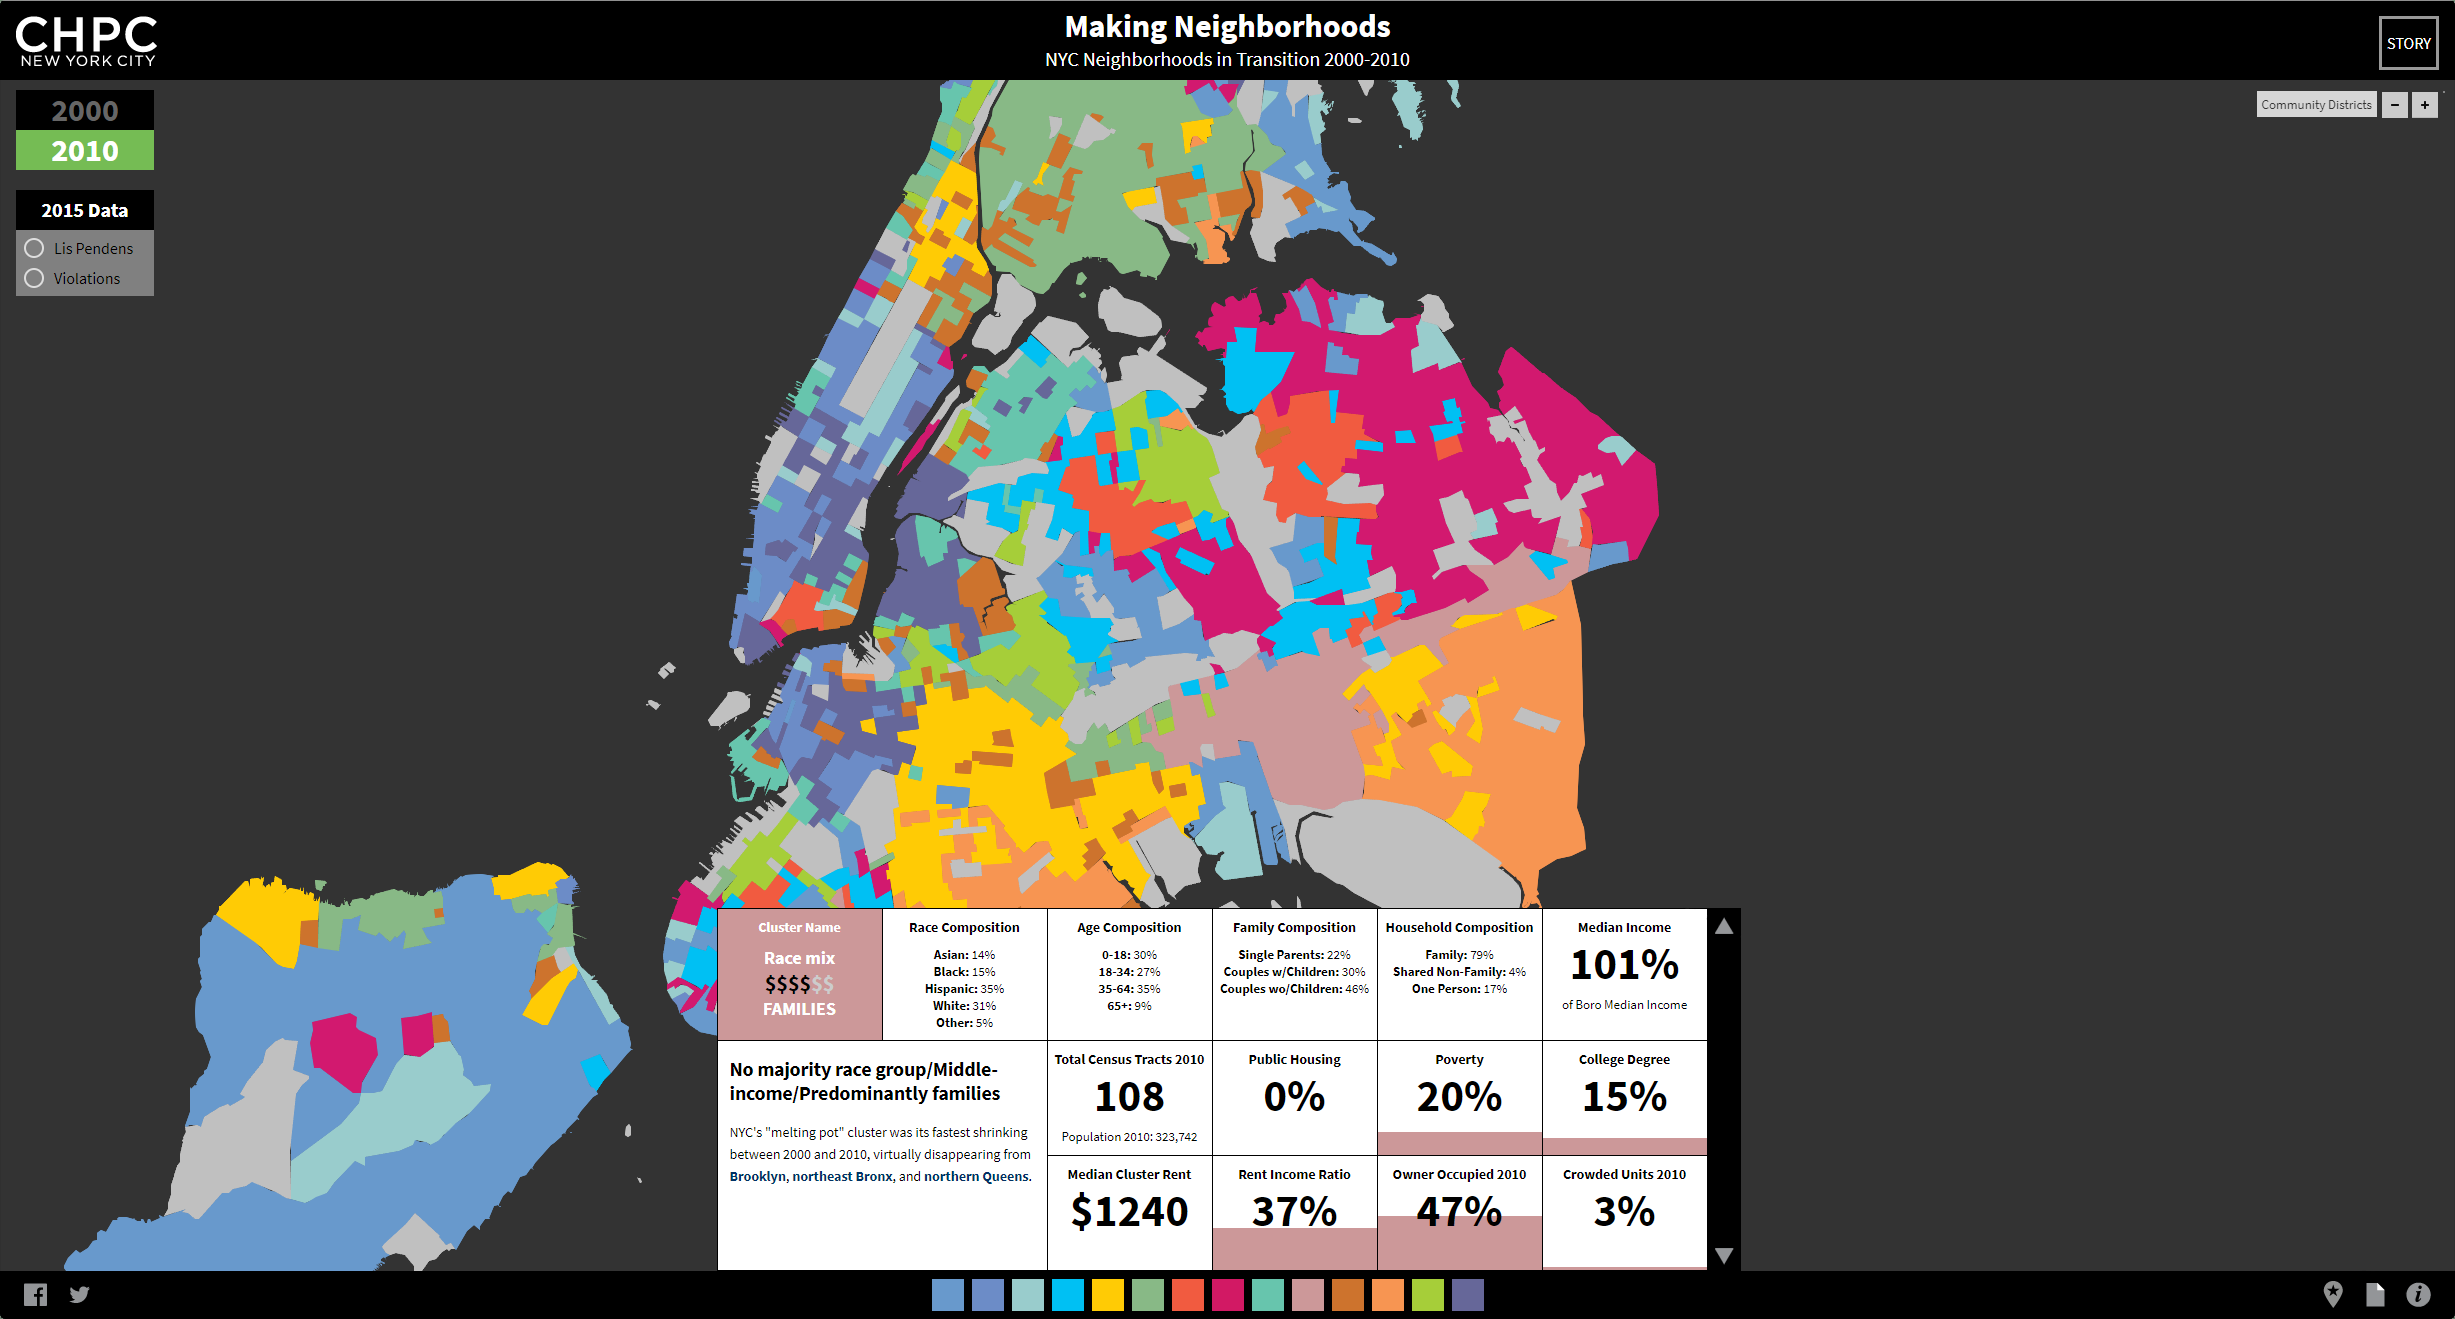
Making Neighborhoods initiative uses cluster analysis, a common strategy in economic and marketing studies, to pars large amounts of data into groups with shared traits. Using 16 variables to measure race, age, foreign birth, household/family type, education level, and poverty, our model identified 14 clusters of census tracts where populations share these characteristics. First, we identified the locations of all of these population clusters in 2000 and then we tracked these clusters 10 years later. The results reveal whether these population types grew in number or geographic size or moved into new areas; if their numbers declined or they retreated from their neighborhoods and were replaced by others; or if groups remained relatively unchanged in a decade. By following groups of people with shared characteristics, we see a different portrait of a changing city. It is one that New Yorkers will recognize, as it reflects the neighborhoods they make for themselves.
cluster analysis
The project uses cluster analysis methodology–common in economic or marketing studies–to identify 16 distinct demographic groups, or “population clusters,” in 2000 and follow their locations in 2010. By comparing the two years, we can see which population types grew in number or geographic size, or moved into new areas; if their numbers declined or they retreated from their neighborhoods and were replaced by others; or if groups’ locations remained relatively unchanged in a decade. By following groups of people with shared characteristics, we see a different portrait of a changing city.
Information dashboard
The information dashboard is a dynamic, scrolling area that provides the user with detailed information depending on which cluster is selected. For each cluster, data on the racial composition, age composition, family composition, percentage foreign born, median income, total number of census tracts in the cluster, percentage living in public housing, percentage living in poverty, percentage with a college degree, percentage owner occupied buildings, and information about the building size.
comparison by year
The year toggle allows the user to switch which data they are viewing between Census years, to compare the changes in the neighborhood clusters from 2000 to 2010.
MAJOR TRENDS IDENTIFIED
Our analysis uncovered five major trends that encapsulate the cluster shifts from 2000 to 2010. Each of the following synthesizes the changes that multiple clusters experienced in that period:
Despite an overall decline by 3% of the city’s white population, four majority-white clusters increased in population. The decade saw increasing concentrations of predominantly white, upper-middle income homeowner areas located in places like Kew Gardens Hills in Queens, Midwood and Windsor Terrace in Brooklyn, and Pelham Bay in the Bronx;
The city’s black population citywide fell by 5%, including the transition of traditionally middle-income black areas to a greater racial mix, as well as wealthier black clusters shading poorer at their borders such as in East Flatbush, Brooklyn, Hollis and Jamaica, Queens, and Woodlawn in the Bronx;
The largest numerical increases occurred among population clusters that are largely white and mid- or high-income, as in Astoria, Queens, Lower Manhattan, and Clinton Hill and Williamsburg in Brooklyn;
Two predominantly white clusters made a subtle transition to being more mixed communities of white and Asian households that are similar in non-racial aspects, such as North Riverdale in the Bronx, Middle Village, Queens, Yorkville in Manhattan, and Bensonhurst, Brooklyn; and
A divergence occurred among predominantly Hispanic clusters: an increase of poor Hispanic clusters, which in 2010 were the largest in number (exceeding 1 million people) such as in East Harlem in Manhattan, East New York in Brooklyn, and Ridgewood, Queens at the same time as Hispanic working class tracts changed to a higher-income cluster, such as in Washington Heights in Manhattan, Elmhurst in Queens, and Sunset Park, Brooklyn.
CARTO map
The map below was created in CARTO, an online mapping platform, as a basis for the amazing web-based mapping application that is shown above (and can be seen at